Extended Pitch Count Estimator
Introducing xPCE
© Tangotiger
Suppose you have a pitcher that goes deep in the count alot. What would you expect the resultant PA to be? Suppose you have a pitcher that rarely goes deep in the count. What will be the outcome of those PAs?
The answer to the second question should be easy. If you don't go deep in the count, you won't expect too many walks or strikeouts, and you should expect alot of balls in play. If you manage to go deep in the count,then the opposite is expected: lots of walks and strikeouts.
Relationships
Let's look at two pitchers: Brad Radke and Randy Johnson. From 1999-2002, Randy Johnson faced 4109 batters, of which 57% put the ball in play. Brad Radke's numbers are 3297, and 81%, respectively.
Our expectation is that Randy Johnson went deep in the count much more than Brad Radke did. Let's do a breakdown of their PAs by how often the PA ended early in the count (0-0, 1-0, 0-1), late in the count (at least 3 balls or at least 2 strikes), and everything else (2-0, 1-1, 2-1).
By that definition, Johnson's PAs ended early 42% of the time, and they went deep 49% of the time. 51% of Radke's PAs ended early, and 37% went deep in the count. These results are consistent with our expectations.
It also follows that if your PAs end early in the count, the number of pitches thrown will be low. Given the information provided, our expectation is that Randy Johnson threw alot more pitches per batter than Radke. Johnson threw 16,298 pitches for an average of 3.97 pitches / batter. Radke checked in with 11,581 and 3.51.
Moving Forward
So, let's recap. We expected Randy Johnson, by looking at only his BIP rate (57%) to have gone deep in the count more than Brad Radke (BIP rate of 81%). We expected Randy Johnson, by having gone deep in the count more than Radke, to have more pitches thrown per batter (3.97 to 3.51). Therefore, we can create a relationship between the BIP rate and the number of pitches thrown.
The other relationship to consider is the K/BB ratio. While not clearly (but somewhat) evident, there is a relationship between the K/BB ratio and the number of pitches thrown. If your K/BB ratio is high, then you went to 3 strikes more than you went to 4 balls, as compared to having a low K/BB ratio. The effect is not that large (.06 pitches per PA, comparing a K/BB ratio of 3 and a ratio of 1), but it still exists.
Models
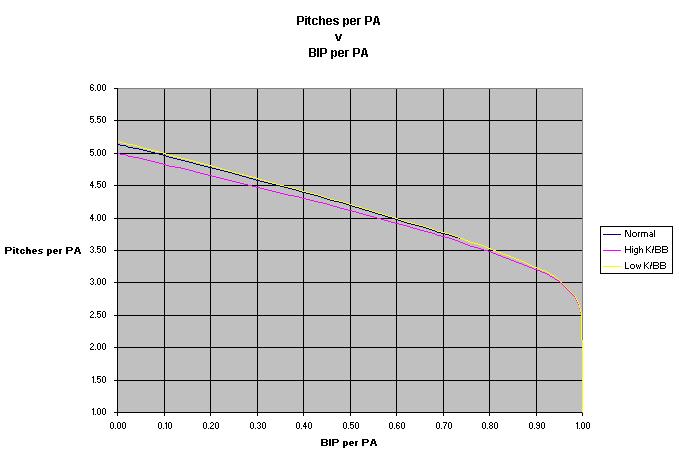
The following image shows the relationship between the BIP rate, and pitch counts, with 3 types of pitchers (high K/BB, norm K/BB, low K/BB). The convergence is that when the BIP rate is 100%, then only 1 pitch per batter is thrown. This is generated from my model.
Now, if you are only interested at the point where the current pitchers are, then the previously published basic pitch count estimator (3.3 x BIP + 4.8 x K + 5.5 x BB) will do the job. The basic pitch count estimator matches the model when the BIP rate is between 50% and 80%.
So, what does the model say? Let's start off with a true equation
Well, that's true if we don't consider HBP, Sacs, and IBB. For ease, I am removing these for the balance of this discussion.
To estimate pitches per BIP, we use the following
That ^ means "to the power of". When the BIP rate is 1, this results in 1 pitch. When the BIP rate is 0, this results in 3.5 pitches. The other two equations are:
The power of this equation is that it can theoretically be applied to any environment (MLB 1911, college 1992, high school 2001, etc), as long as that environment uses the current 4-ball, 3-strike, 2-strike-foul rule.
Unfortunately, we don't even have PA for all pitchers historically, and so we have to estimate this figure as well. For IBB, I would stick to IBB = 4 pitches. For HBP and sac bunt, I would use the "BIP" equation.
Next Step
Now that we did all this theoretical work, let's bring back the basic pitch count estimator (bPCE), compare that to the xPCE, and to the actual totals for our 2 extreme pitchers.
Randy Johnson, according to the bPCE (which uses fixed values for the pitches per BIP, BB, and K) is estimated to throw 3.93 pitches per batter. The xPCE says 4.00, and he actually threw... 3.97. And Radke? bPCE says 3.57, xPCE 3.49, ... and actually 3.51.
For the majority of the time, the basic pitch count estimator will do the job just fine. The xPCE model has a certain mathematical certainty as the BIP approaches 1.
This model was developed with some other work that I'm doing with pitch counts, and these two data points (RJ and Radke). I encourage other sabermetrician to pick up where I left off, add even more data points, and try to tweak the xPCE. I'm reasonably certain that the basis for the model is correct, but this would be better established with actual data.

   Number of pitches per batter faced = Pitches per BIP x BIP rate
                                      + Pitches per BB  x BB rate
                                      + Pitches per K   x K rate
Pitches per BIP = 2.5 x [(1 - BIP rate) ^ 0.08] + 1.
   Pitches per BB  = 1.5 x [(1 - BIP rate) ^ 0.10] + 4.
   Pitches per K   = 1.9 x [(1 - BIP rate) ^ 0.07] + 3.