How are Runs Really Created - Third Installment
By Tangotiger
Part 5 - Some real-life examples
Previously...
Okay, so where do we stand? We know that what we are after is the rate at which runners score, given all the input variables. We know that when using the plus 1 method, the marginal impact of each event in the 1974-1990 environment must correspond to the actual run values, previously published. If we accept BaseRuns' theory on how the rate at which runners score is calculated (B/(B+C)), then we have to provide the coefficients in the "B" equation which corresponds to an actual known environment (1974-1990), and is verified against the plus 1 method. We've done this [in the last article].
What we don't know, yet, is if we can apply this equation to other environments, or to even extreme environments, like a team of Pedros or a team of Bonds or even weird profiles like Rob Deer. All we have to do is run our simulator. We will create various run environments, apply the formula that was fixed for the 1974-1990 environment, and see if it holds up against these other run environments.
To sim or not to sim
I've received (legitimate) complaints regarding the use of a simulator. After all, can we really accurately capture everything that happens in baseball? Yes, we can. But does my simulator actually do all that? No, it doesn't. For example, I do not have it put in a typical batting order, rather making everyone average. Since the results of doing this is remarkably close to what actually happened, there's very little to be gained by making it lineup-specific. (Other questions would necessitate such a thing, like when to walk Barry, when to sac bunt, etc). The other complaint, which I find more substantive, is that no one could reproduce my work without having a similar sim. That's true. And without peer review, who's to say that I'm not just making all this stuff up?
Retrosheet is a great site. Not only do they have the play-by-play event logs that I base all my programs on, but they also have "game logs" that show each team's game totals, game-by-game, since 1900. What can we do with this information? Lots!
Most run evaluators are measured against the seasonal team totals. The main reason is that seasonal totals removes much of the noise that exists in game totals. If one team gets 11 hits, 1 HR, and 3 walks and scores 8 runs, while another scores 2 runs, does that tell us much? There are two problems with aggregating by team. The first is that since the majority of the teams are clumped to the average (OBA of .300 to .360 is not that wide a difference), that we can't find the true differences. (Sure, run your regression, and you can get decent results.) Secondly, by aggregating the daily game-logs into seasonal totals by team, you are introducing a bias. Baserunning, parks, and opposing pitching will still pollute the totals. By aggregating all the 1987 Cardinal games, you are not accounting for their superior baserunning speed, or their park, or that they didn't have to face their own pitchers. Even worse, you are introducing this bias, rather than hope that it "cancels out" by having a larger sample size.
Reduce noise, remove bias
For the balance of this article, I will group the 1974-1990 game totals to reduce the noise, and not introduce any biases. Here are the game-by-game totals, summed by the number of HR hit in the game. The columns represent the number of HR hit, the number of games, actual runs scored, the BaseRuns estimate, the Linear Weights estimate, and the basic RC estimate.
     Runs Scored, breakdown by HR hit

     HRclass     n      R     BsR    LWTS    RC
         0    33,068   3.08   3.06   3.79   3.03
         1    23,117   4.62   4.62   4.44   4.66
         2     9,218   6.12   6.12   5.00   6.41
         3     2,838   7.65   7.65   5.62   8.37
         4       687   9.03   9.00   6.07  10.29
         5       146  10.55  10.49   6.73  12.45
         6        40  12.33  12.32   7.52  15.35
         7         9  16.22  14.32   8.34  18.27
         8         2  14.00  15.87   8.58  22.52
        10         1  18.00  18.30   9.51  27.03
Note: I am adjusting each of the various run evaluators to account for the information that we have, such that the overall runs scored for 1974-1990 matches the estimate.
A clean sweep for BaseRuns among all HR classes! Linear Weights woefully underscores the number of runs estimated in the high HR games, and Runs Created is equally poor the other way. This is in-line with our expectations. While RC has the right idea, its improper handling of the HR is magnified in this set of data. The static values of Linear Weights shows its inadequacy.
Score rate
As was discussed, the key to the run model is the score rate. Working backwards, we can determine the score rate implied by the LWTS and RC method (for BaseRuns, we know it is based on the B and C components). Representing the above chart, here are the score rates:
     Score rate, breakdown by HR hit

     HRclass      n      SR     bsr_SR lwts_SR  rc_SR
         0     33,068   0.267   0.265   0.328   0.262
         1     23,117   0.304   0.304   0.289   0.307
         2      9,218   0.340   0.340   0.247   0.364
         3      2,838   0.373   0.372   0.210   0.430
         4        687   0.404   0.401   0.166   0.504
         5        146   0.430   0.426   0.134   0.578
         6         40   0.454   0.454   0.109   0.671
         7          9   0.610   0.484   0.089   0.746
         8          2   0.414   0.543   0.040   1.001
        10          1   0.533   0.554  (0.033)  1.135
Now it starts to make more sense. BaseRuns correctly determines the percentage of given baserunners that should score, for each HR class. But look at Linear Weights. Not only does it underestimate, but it actually is saying that there is a fewer percentage of runner scoring the more HR that are hit! Runs Created starts off fine, but as the number of HR starts to accumulate, its expectations of the % of runners score grows at too fast a rate, with no cap at 100%. With 10 HR, Linear Weights estimates negative runs per runner, while Runs Created estimates more runs than runners. The above chart as an image makes it quite clear:

It is good to remember that the design of RC and LWTS was based on "normal" hitting conditions. While they do fine in that regard, we see here the results of extrapolating into extreme conditions.
Here are all the score rates grouped by on-base average (in groups of .050).

Linear Weights and Runs Created both had negative numbers for the lower level of OBA. Runs Created does work fine for this set of data (because the % of hits that are HR is uniform across the data). Linear Weights also works okay for a particular set of data. As noted in the previous article, all the run estimators work fine when the OBA is between .300 and .400. This image shows this to be true. BaseRuns clearly overestimates at the .500 to .800 OBA levels.
Since we've got the data, let's construct more groupings. (Note: at no time should the grouping be based on runs scored. This is what we are trying to study, and any selection based on runs scored will be tainted.) Let's select based on OPS (in groups of .100).
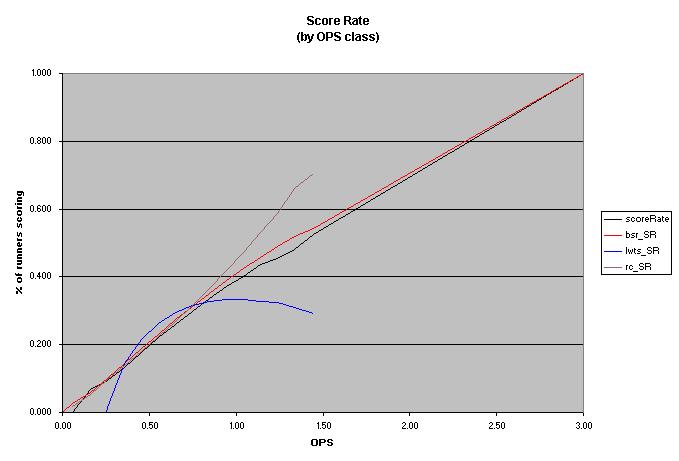
Hmmm, BaseRuns seems to hold up pretty well with games having high OBA and high SLG. Since the "HR effect" is not masked as it was with the OBA groupings, we see very clearly how Runs Created and Linear Weights both break down at the high end. BaseRuns on the other hand tracks the actual score rates very well.
I'm certain that there's some combination of hits, HR, and walks where BaseRuns breaks down. But that is not based on the error in the design, since the design of BR x score Rate + HR = Runs is a true one by definition. Rather it would be in the B and C components that the BaseRuns is modeled after. As mentioned, while there is probably some other derivation of score rate that will be more accurate than what BaseRuns proposes, it will probably be not as elegant.
As well, any run measure that does not follow the design based on the score rate is doomed to fail at one extreme or another. The score rate is capped at both ends at 0% and 100% (meaning that you can't have more runs scored than baserunners + HR). This must be enforced by any run model. And BaseRuns is the only model that adheres to this constraint.
Part 6 - Extrapolating to players
Ripple effects
Heisenberg Uncertainty Principle: the separation between the observer and the observed is always more-or-less arbitrary
Throw a pebble in a pond, and you will see some effects. The water will ripple on the surface in a particular pattern, the pebble will hit the bed causing whatever is on the floor to move to some degree. In all though, the equilibrium of the pond system has barely been altered. Drop a watermelon in an aquarium, and there will be much more changes. So much more changes that this aquarium system is no longer an aquarium system, but rather an aquarium system with a watermelon in it, and a new equilibrium will be reached based on the existence of the watermelon.
When we used the "plus 1" method to the hundreds of thousands of PAs of 1974-1990, it was like dropping a pebble in a pond. The dynamics of how runs are scored remained virtually the same. We are confidant that adding 1 HR to such a large system would not alter this system, and therefore we can measure the changes in the system and attribute that change solely to the HR.
If we have a system, say the 2002 Giants, with a player like Barry Bonds, and you have another system that has the same 8 players, but with some average player in Barry's place, you have two distinct systems. The players playing with Bonds have a certain run value for each of their accomplishments because of the potential that Barry has when he steps up to the plate. Getting a walk with Barry on deck is much more valuable than getting a walk with an average hitter on deck. Barry defines (part of) the system.
With or without you
The standard way to determine Barry's run impact to the Giants is to determine how many runs they'd score with him, and how many they'd score with some "replacement". The replacement player should not just be anything. Make him too bad, like a pitcher, and you alter the system again. The expectation of the other 8 players in the lineup is that an average team will use their average resources to make average moves so that they have an average player to play with. Therefore, the controlled environment to compare Barry to would be one that has his 8 teammates, plus an average player. The new environment has Barry playing with his 8 teammates. The difference in the result of these two different run environments will show Barry's run creation ability above an average player to the 2002 Giants. (Note: As mentioned last time, a +1 player in 300 PA is not necessarily "better" than a -1 player in 600 PA. The determination of who's better than who is outside the scope of this article.)
Custom Run Values
While we can produce custom run values by run environment that would apply equally to all players playing in that run environment, this would technically be the wrong thing to do. The reason is that each of the 9 players on a team plays in a different run environment. Barry doesn't get to drive himself in if he gets on base. Jeff Kent does get to score more if he gets on base and Barry is on deck. For the most part however, the effect of one player is very minimal in changing the run environment in which he plays (more like a pond than an aquarium). Therefore, using custom run values by run environment that applies to all players in that run environment is an acceptable alternative, for ease. But correctly, you have to measure the player against the environment that he finds himself surrounded by. The player cannot define his own run environment.
The problem here is that by not using the same custom run values for all players on the same team, you cannot guarantee that all the marginal run values of these players will add up on the team level. As mentioned in the first article, baseball is non-linear and interdependent. There is no expectation that everything should add up. Even accepting the nonlinearity and interdependence of run creation, it would add up almost exactly, if the player's effect was on a pond system. But with a player being one-ninth of the team, we don't have that luxury. You are left to either use the simpler custom values by team, or to apply adjustments after the fact such that everything adds up.
Since we have BaseRuns, we can use the plus 1 method to determine the run values for various run environments. Here is the custom linear weights value, by OBA
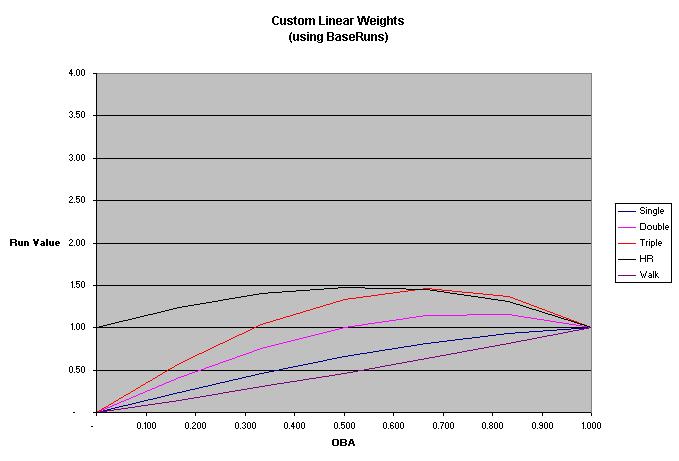
We see that BaseRuns does break down with respect to the run value of the triple when the OBA is very high. Overall, however, this image certainly looks familiar, doesn't it? In the first article in this series, I asked that we just use our common sense to determine the run values. Here is that image again:

So, what do we have? BaseRuns conforms almost exactly to reality, and almost exactly to our common sense of what each hitting component's run value is in various run environments.
I've previously published preliminary custom run values. With some new data at my disposal, I will be updating that chart to more accurately reflect each team's run environment.
Read this once, and forget I said it
If you did want everything to add up, you can perform some math wizardry. Start off with 9 average players. Then, change the leadoff hitter such that he moves 1/600th towards what the real leadoff hitter does (say add 1 hit to the 160 hits that the average hitter would hit). Measure the change. Then, do the same for the #2 through #9 hitter. Then, keep cycling through, each time making a minute change to the player in question, and measuring the change. Keep doing this until you end up with the actual 9 Giants. In this manner, you are trying to create a pond system. You want such minute changes that the run environment, after each change, barely changes. But after 5400 such moves, you end up with a brand new run environment. Again, you could make the changes 1/1,000,000th, and make 9 million moves to be more accurate. In this way, you are ensuring that everything will add up on the team level, and you are better controlling the run environment. Unless you are crazy, I suggest you not do this.
Part 7 - Conclusion
The king is dead, long live the king
Runs Created is dead. It should only be used for "back of the envelope" calculations.
BaseRuns is the now. It is the only run evaluator that I am aware of that follows the definition of how runs are created. The search for run evaluators now is to determine the best estimator for the score rate.
Linear Weights is alive and well. It is the foundation for a whole series of run estimators and run modelers. Custom Linear Weights is a necessary offshoot (which we can determine using BaseRuns). Linear Weights by the 24 base-out states is another critical component. Linear Weights by batting order. By park, by fielders, by pitchers. There's really no end to this.
The holy grail would be Win Expectancy that includes the hitting team, the fielders, the pitchers, the park, the inning, the score differential, the base-out states, and the batting order. I believe that Pete Palmer has some of this already, and last year I had created a preliminary WE matrix using some of these variables (it wasn't mathematically generated, and therefore, it should be taken with a grain of salt). I believe that I have all the tools and information required to produce the holy grail. Since the philanthropist and venture capital markets don't exist for sabermetrics, I will only be able to devote my spare time to this pursuit.
Questions, comments, requests
This concludes my series on this topic. If there are any questions, comments, or requests, feel free to make them. Please refrain from "who's better than who" or "top 10" type requests. Those have a habit of snowballing. Otherwise, thank you for reading.