
How to create an NHL player forecasting system, Marcel-style
So, this weekend, there was some Twitter chatter, where one prominent hockey group had McDavid forecasted with 130 points, while another had him at 97 points. And this gave me the early 2000s vibes, when the baseball landscape was littered (and I use littered literally) with so many half-baked forecasting systems that I was getting annoyed. And when I get annoyed, I get saber.
Let me recap what I did, and how you fine folks out there can take up the mantle. Forecasting in hockey is like in baseball: we care about relevant stats, recent stats, and their age. Each link provided will point you to the Twitter post.

If you are looking to forecast NHL points, first thing you have to do is forecast NHL games. There's the naive approach using single season only (which I will show now), then a second level approach which takes multiple year, then third level approach which includes time on ice.

This is forwards only.
What this shows at the high end is that whatever number of games you played (in a normal full season), you'll play 10 fewer games the following season.
At the low end, you basically start off at playing 15 games the next season. The black line is the trendline for all the data. But if you split up the data based on whether you played half the season or not, then you have two different trendlines.
You can also bin the data to better understand the data like so.
The black dashed line is y=x.

Here's based only by time on ice per game. This is aggregated into 15 bins. Of course, binning just smooths everything out so it looks as even as it does. You can see at the top-end, we max out at 76 games even for the high performers.
Best fit: 6 x TOI - 33 (up to 17.5 min)

We can combine the two: Games Played in most recent season X time on ice per game (min 15 players in any bin).
Chart clearly shows both equally impactful. To forecast next season's number of games, you want to have current season's number of games AND minutes per game.

Finally, we can also forecast minutes per game using the same two parameters.
As you can see, minutes per game is VERY constant: almost no regression needed! If you are a 19 minutes per player game in the current season, you'll be 19 next season. If you are 13, you'll be 13.
Forecasting Points Per Game for the star players is 95% of their prior season.
So, this is what we'd expect of McDavid: in the last two seasons he averaged 1.68. We take 95% of that, or 1.6 pts per game. We max out any player at 74 games. 74 x 1.6 = 118 points.
Here's the chart. I wouldn't apply this too strictly with the players at the lower end in games and points per game.
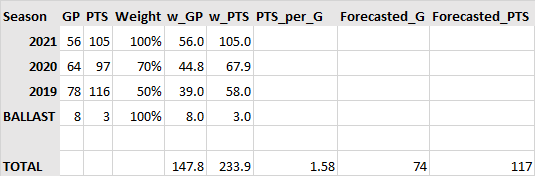
Roughly speaking, you can get a similar chart by applying a regression toward the mean component (adding a ballast) of 8 games and 3 points.

I'll also assume a weighted average. Not sure what that is yet, but let's say you take 100% of most recent season, 70% of prior season and 50% of season before that. This is how it looks like for McDavid.
We also need a minor age adjustment (and figure out the ACTUAL weights).
By the way @billjamesonline was doing this 40 years ago, but he didn't call it "Bayes Theorem" and "Regression Toward The Mean". Instead, he used more natural terms: Law of Competitive Balance, Plexiglass Principle, and Ballast.

Given the choice, statisticians will use and reuse alpha and beta any chance they get. And will even use the beta parameter for the Beta Distribution. Even though the thing we ACTUALLY care about is the ballast, alpha+beta, and the mean alpha/(alpha+beta)